Debugging and Optimizing Parallel Codes with Linaro Forge

→ Europe/Warsaw
(online)

online

Rudy Shand (Linaro)
Description

Modern HPC workloads span diverse programming environments, combining multi-core CPUs, heterogeneous GPUs, hybrid execution models, and high-level programming environments. This course provides a structured workflow for diagnosing concurrent runtime errors, isolating memory anomalies, eliminating scalability bottlenecks, performing thread affinity analysis, tracking energy consumption, and conducting differential performance comparisons across these diverse programming environments.

This two-session training course equips HPC developers with the advanced diagnostic and profiling capabilities required to debug, optimise, and scale complex parallel applications using the Linaro Forge suite (Linaro DDT, Linaro MAP, and Linaro Performance Reports).

Level

Target audience

Researchers and software developers who want to understand how to profile their code, especially code running in parallel on HPC systems or using GPUs.

Agenda

Session 1: High-Performance Parallel Debugging & Correctness with Linaro DDT

Session 1 introduces developers to non-intrusive parallel debugging techniques using Linaro DDT. Participants learn how to attach to live jobs, analyse process synchronisation issues, locate memory leaks, and debug complex GPU kernels across heterogeneous hardware without altering application source code.

Module 1.1: Foundations of Parallel Debugging & Linaro DDT 

  • Architecture of Linaro DDT: Client-server model, non-intrusive process control, and tree-based scalable architecture for high-rank job attachments.
  • Process & Thread Navigation: Grouping MPI processes, filtering by rank condition, stepping through execution across a range of processes simultaneously.
  • Variable Visualisations: Cross-process evaluation, multidimensional array viewing, matrix visualizers, and variable comparison views across MPI ranks.
  • Advanced Control Flow: Conditional breakpoints, tracepoints, global watchpoints, and synchronising asynchronous thread groups.

Module 1.2: Multi-Architecture GPU Debugging

  • Heterogeneous GPU Debugging Support: heterogeneous debugging workflows
  • GPU Thread Navigation: Kernel launch inspection, GPU block/grid warp stepping, register inspection.
  • Memory Integrity & Safety: Detecting out-of-bounds GPU memory accesses, uninitialized device memory reads, misaligned pointer dereferences.

Module 1.3: Advanced Debugging Workflows & Python Integration

  • Mixed-Language Debugging: Debugging Python applications with embedded C/C++ or Fortran extension modules.
  • Python Parallel Debugging: Stepping through Python interpreter stack frames, process state inspection in parallelized Python scripts.
  • Advanced Memory Debugging: Guard pages, heap corruption detection, dangling pointer isolation, and memory leak analysis.
  • Offline Debugging & Automated Crash Dumps: Generating non-interactive diagnostic logs and post-mortem crash analysis for batch cluster jobs
Session 2: Performance Profiling, Optimization & Energy Analytics with Linaro MAP & Performance Reports

Session 2 focuses on characterising application performance and scaling bottlenecks using Linaro Performance Reports and Linaro MAP. Participants learn how to identify hardware sub-optimality, evaluate NUMA and thread affinity, compare performance across compiler options using MAP Diff, and analyze energy efficiency across CPU and accelerator workloads.

Module 2.1: High-Level Characterization with Linaro Performance Reports

  • Automated Job Metrics: Generating non-intrusive baseline performance summary reports for batch executions.
  • Metric Breakdown: Quantitative breakdown of compute time (vectorisation vs scalar), MPI communication overhead, I/O bandwidth, and memory access boundness.
  • Hardware Efficiency Scoring: Evaluating whether a code is CPU-bound. I/O-bound or communication-bound to guide subsequent profiling steps.

Module 2.2: Deep Dive Profiling with Linaro MAP

  • Low-Overhead Adaptive Sampling: How MAP samples process states with minimal runtime distortion (<5% overhead).
  • Thread Affinity Analysis & NUMA Binding: Identifying suboptimal core bindings, thread migration, NUMA remote node accesses, and OpenMP thread imbalance.
  • Multi-Architecture GPU Profiling: Monitoring GPU kernel execution times, memory transfers, memory usage, and GPU utilisation.
  • I/O & MPI Bottlenecks: Line-level profiling of MPI point-to-point/collective operations and asynchronous file I/O operations.

Module 2.3: Advanced Analytics: MAP Diff, Energy Metrics & Python Profiling

  • MAP Diff Profile Comparisons: Performing differential performance analysis to compare two profiles (e.g., baseline vs. optimized, compiler A vs. compiler B, or core scaling runs).
  • CPU & Workload Energy Metrics: Profiling real-time energy usage, CPU package energy consumption, and system energy efficiency.
  • Python Line-Level Profiling: Overhead attribution in hybrid Python applications, isolating interpreter overhead from low-level compiled library execution.

About the Presenter

Rudy Shand is a leading expert in high-performance computing (HPC) debugging and profiling, currently serving as a Technical Services and Support director at Linaro. With over 14 years of experience in the field, Rudy specializes in optimizing, debugging, and porting complex HPC codes to ensure maximum program correctness and scalability.

His career includes a decade-long tenure at Arm, where he focused on the development and quality of Arm-based debuggers and profilers. Since joining the Linaro Forge team in 2022, Rudy has transitioned into a pivotal role driving technical debugging and profiling expertise across  HPC and AI/ML communities.

An accomplished speaker and educator, Rudy has delivered key technical talks and training workshops at major industry events, including SOS’27, CUG, ATPESC, and ISC. He holds a degree in Cybernetics and Electronic Engineering from the University of Reading. Rudy is dedicated to empowering developers to conquer the challenges of modern parallel programming, from single-node systems to the world’s largest supercomputers.

Requirements

Participants should be familiar with submitting jobs with SLURM, understand MPI, and know at least one of the programming languages C, C++, Fortran, or Python. In addition, they should have a basic grasp of debugging and performance engineering.

Venue

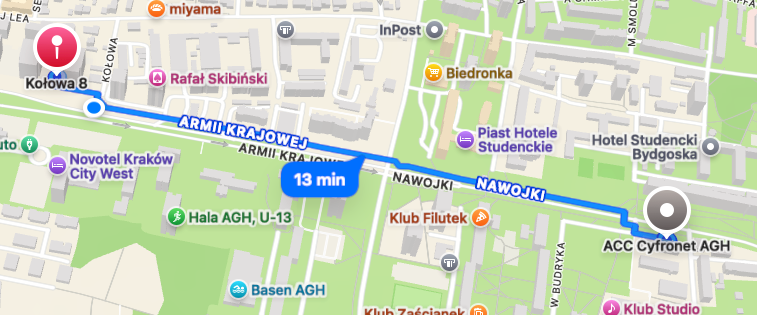
The workshop will be conducted on-site in conference rooms on the ground floor of the Edison office building at Kołowa 8, Kraków, which is about a 15-minute walk from the main ACC Cyfronet Building at Nawojki 11.
Language

English

Duration

4 hours of workshop

Registration

Registration and the Waiting list close automatically at 23:59 CET on 30th November 2026. The registration may close prematurely if the participant limit is reached, but the Waiting List will remain available until the deadline above. We're moderating registration due to logistical constraints. You will be notified about acceptance no later than 2nd December.

Please use your institution's e-mail address. Registrations using generic or private e-mail addresses cannot be accepted. At that e-mail address, you will be contacted with further information.

This course is co-funded by the European Union. Therefore, the course is open to participants from academia, industry, and public administration from the Member States (MS) of the European Union (EU) and Associated/Other Countries participating in the Horizon Europe programme.

Organized by

Funded by

Acknowledgements

EuroCC 3 has received funding from the European High-Performance Computing Joint Undertaking (JU) under Grant Agreement No. 101306701. The JU receives support from the European Union's Digital Europe Programme and Germany, Albania, Austria, Belgium, Bosnia and Herzegovina, Bulgaria, Croatia, Cyprus, Czechia, Denmark, Estonia, Finland, France, Greece, Hungary, Iceland, Ireland, Italy, Latvia, Lithuania, Luxembourg, Malta, Montenegro, the Netherlands, North Macedonia, Norway, Poland, Portugal, Romania, Serbia, Slovakia, Slovenia, Spain, Sweden, Türkiye, and Kosovo.

Organised by

ACC Cyfronet AGH

Registration
    • 10:00 → 12:00
      Session 1: High-Performance Debugging & Correctness with Linaro DDT

      Session 1 introduces developers to non-intrusive parallel debugging techniques using Linaro DDT. Participants learn how to attach to live jobs, analyze process synchronization issues, locate memory leaks, and debug complex GPU kernels across heterogeneous hardware without altering application source code.

      • 10:00
        Module 1.1: Foundations of Parallel Debugging & Linaro DDT 40m
        • Architecture of Linaro DDT: Client-server model, non-intrusive process control, and tree-based scalable architecture for high-rank job attachments.
        • Process & Thread Navigation: Grouping MPI processes, filtering by rank condition, stepping through execution across a range of processes simultaneously.
        • Variable Visualizations: Cross-process evaluation, multidimensional array viewing, matrix visualizers, and variable comparison views across MPI ranks
        • Advanced Control Flow: Conditional breakpoints, tracepoints, global watchpoints, and synchronizing asynchronous thread groups.
      • 10:40
        Module 1.2: Multi-Architecture GPU Debugging 40m
        • Heterogeneous GPU Debugging Support: heterogeneous debugging workflows.
        • GPU Thread Navigation: Kernel launch inspection, GPU block/grid warp stepping, register inspection.
        • Memory Integrity & Safety: Detecting out-of-bounds GPU memory accesses, uninitialized device memory reads, misaligned pointer dereferences.
      • 11:20
        Module 1.3: Advanced Debugging Workflows & Python Integration 40m
        • Mixed-Language Debugging: Debugging Python applications with embedded C/C++ or Fortran extension modules.
          -Python Parallel Debugging: Stepping through Python interpreter stack frames, process state inspection in parallelized Python scripts.
        • Advanced Memory Debugging: Guard pages, heap corruption detection, dangling pointer isolation, and memory leak analysis.
        • Offline Debugging & Automated Crash Dumps: Generating non-interactive diagnostic logs and post-mortem crash analysis for batch cluster jobs.
    • 12:00 → 12:20
      coffee break 20m
    • 12:20 → 14:20
      Session 2: Performance Profiling, Optimization & Energy Analytics with Linaro MAP & Performance Reports

      Session 2 focuses on characterizing application performance and scaling bottlenecks using Linaro Performance Reports and Linaro MAP. Participants learn how to identify hardware sub-optimality, evaluate NUMA and thread affinity, compare performance across compiler options using MAP Diff, and analyze energy efficiency across CPU and accelerator workloads

      • 12:20
        Module 2.1: High-Level Characterization with Linaro Performance Reports 40m
        • Automated Job Metrics: Generating non-intrusive baseline performance summary reports for batch executions.
        • Metric Breakdown: Quantitative breakdown of compute time (vectorization vs. scalar), MPI communication overhead, I/O bandwidth, and memory access boundness.
        • Hardware Efficiency Scoring: Evaluating whether a code is CPU-bound. I/O-bound or communication-bound to guide subsequent profiling steps.
      • 13:00
        Module 2.2: Deep Dive Profiling with Linaro MAP 40m
        • Low-Overhead Adaptive Sampling: How MAP samples process states with minimal runtime distortion (<5% overhead).
        • Thread Affinity Analysis & NUMA Binding: Identifying suboptimal core bindings, thread migration, NUMA remote node accesses, and OpenMP thread imbalance.
        • Multi-Architecture GPU Profiling: Monitoring GPU kernel execution times, memory transfers, memory usage, and GPU utilization.
        • I/O & MPI Bottlenecks: Line-level profiling of MPI point-to-point/collective operations and asynchronous file I/O operations.
      • 13:40
        Module 2.3: Advanced Analytics: MAP Diff, Energy Metrics & Python Profiling 40m
        • MAP Diff Profile Comparisons: Performing differential performance analysis to compare two profiles (e.g., baseline vs. optimized, compiler A vs. compiler B, or core scaling runs).
        • CPU & Workload Energy Metrics: Profiling real-time energy usage, CPU package energy consumption, and system energy efficiency.
        • Python Line-Level Profiling: Overhead attribution in hybrid Python applications, isolating interpreter overhead from low-level compiled library execution.
